TallyT
Tally
Jul 5

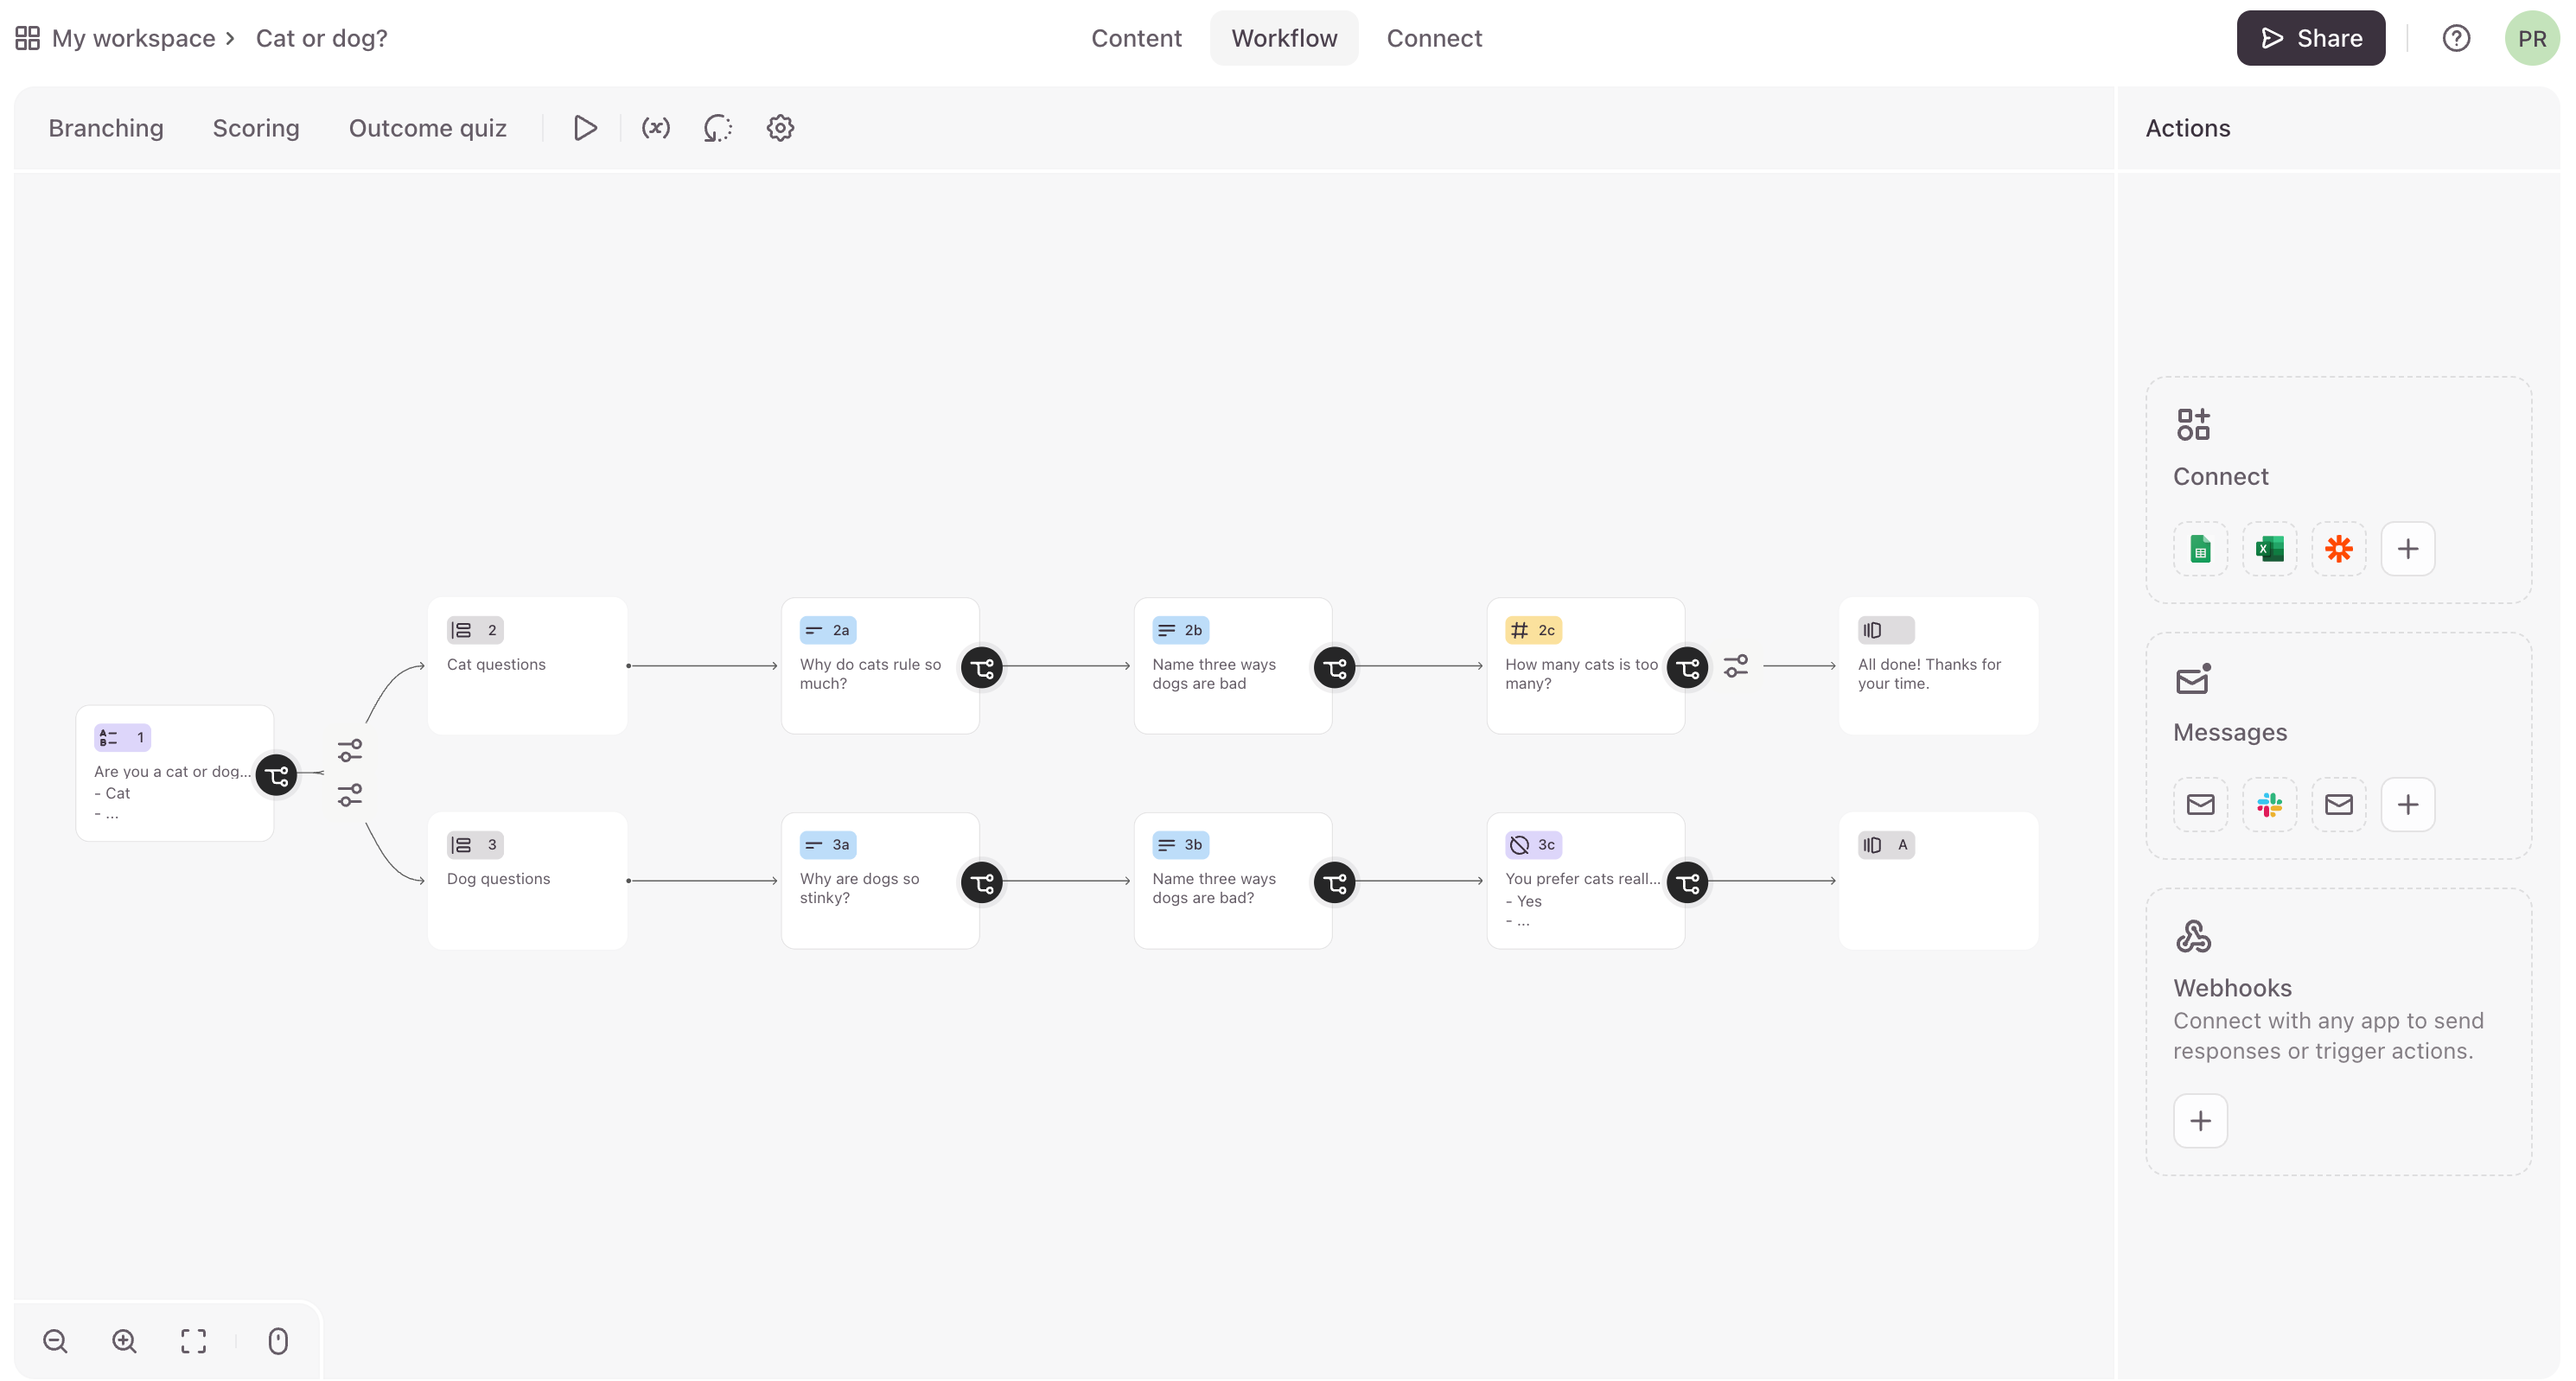
Visual representation of the form's logic (logic map, flow builder/diagram)

In more complex flows, it would be really helpful to be able to see the flow's logic as an algorithm with blocks and arrows based on the conditions set up in the editor.
PendingPending

merged·Aug 10, 2026
merged·Mar 23, 2026
merged·Feb 20, 2026
Feb 20, 2026
from

Hi Maé, Thank you very much for the detailed and thoughtful feedback — it absolutely makes sense. Improving conditional logic to make it more intuitive and easier to manage is definitely something we’re actively working on. We’re also exploring ways AI can help simplify building and understanding logic in the future. Thanks again for sharing this — your feedback is truly valuable and taken into account 🙌

Sep 22, 2025

Thanks for the suggestion, Hamza! We really appreciate you taking the time to share it 🙏

Jul 19, 2025

Exactly! Something like what Typeform does

Jun 16, 2025

Thanks for the suggestion — much appreciated! We'll keep this in mind as we continue to improve conditional logic features.

Dec 17, 2024

Yes indeed this would be helpful. I would suggest more than a flowchart to have it like a vertical mindmap that shows the conditional logic with the pointed arrow. Plus if this mindmap could be printed or exported as html.

Nov 26, 2024

just found this a few days back - should be useful: https://reactflow.dev/

Nov 26, 2024

J33T Shah: thanks, very interesting!

Nov 20, 2024

Hi Khirmer Dia, thanks for this request! For my understanding, would you like to have a visual representation of what happens within the form itself (how the respondent moves between pages, dependent on conditional logic) or see how the form is interacting with other tools and intagrations (as you could do in zapier, make, ...)?

Nov 20, 2024

Frederik Simoen * "happens within the form..." Yes, especially for people who wants to tailor the form results based on the data the user input. * Zapier, integration. That is also an interesting concept. ;) If you did that, it will become not just a simple "form" anymore, and almost look like a mini SaaS depending on the product. I think with the idea above, more people will want to use Tally, because they can really tailor the responses based on their user input. That is also what I am trying to achieve personally with Tally, I have started a mini landing page that answers questions about IT related issues for some target audience, so they can get a pre made general advice based on their response. This way, the users who answer the form gets value from the form creator! for xMatters, the example I posted above, what I like about them is that you can have different input on each form based on the previous "node", can also trigger difference response. What I also loved is their developer friendly capabilities such as a "custom node", where you can code custom JS for input, some processing, and output. Regards, Khirmer

Nov 20, 2024

Frederik Simoen You can try to register to xMatters, then try their workflow designer, honestly, that is one of the most intuitive developer UI I've found in the market. As a DevOps myself, I find their product more customizable based on the org or teams "flow and culture", and not opinionated.

Nov 22, 2024

Hi Khirmer Dia thanks for clarifying. So if I understand correctly, with such a feature the current linear visual representation of a Tally form (in which conditional logic steps for jumps to another page are just blocks) could also be visualized as some kind of flowchart of how respondent's different answers lead to different pages within the form? I see how that might be an interesting to visualize the form workflow in a different way than we do today. While I can't make any promises about if or when it might be implemented, rest assured that you'll see updates here if anything changes. Thanks again for your contribution!

Oct 15, 2024

this would be the ultimate! I love the layout of the current logic blocks, but yes, for more complex logic flowcharts are much better.